
Step by Step how to copy & paste widgets in vRealize Operations Manager 8.0
VMware vRA_vROPsHave you ever seen
widgets from different dashboards you wanted to combine into a new custom
dashboard? Do you also not want to waste
time recreating the wheel? If the
answers to these questions are yes then here is a step by step cheat I use
leveraging copy/paste of widgets to generate quick custom dashboards.
My example:
i want to take a vCenter view of my environment and see all the VM CPU > 80%
metric for any of my vCenters in a particular location.
Step by step of copy
and paste
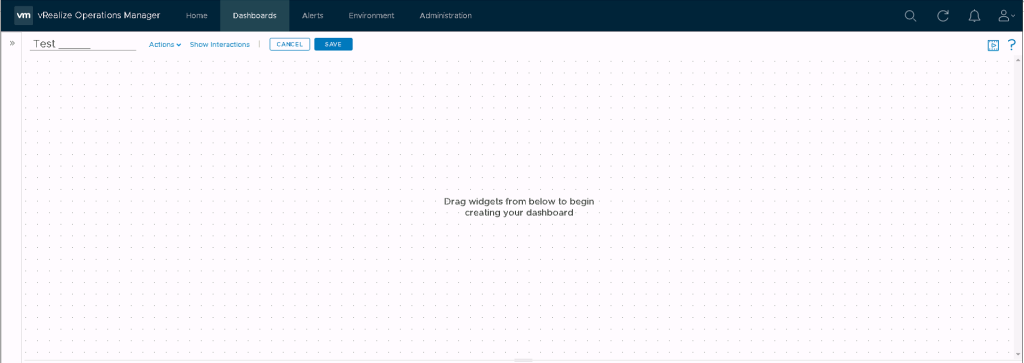
First let’s go to
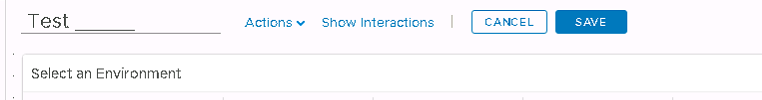
dashboards create new dashboards. Then
let’s give it a name. My example is Test
____
Now open a second
tab and go to the first dashboard you want to copy from. My example is using a select an environment
widget I like to use to either select via vSphere World, vCenter or Host &
Cluster. For this example it will be the
vCenter level.
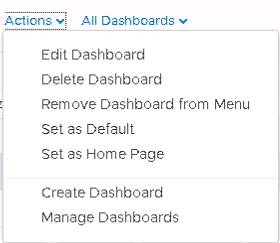
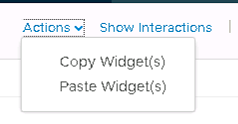
First go to Edit
Dashboard
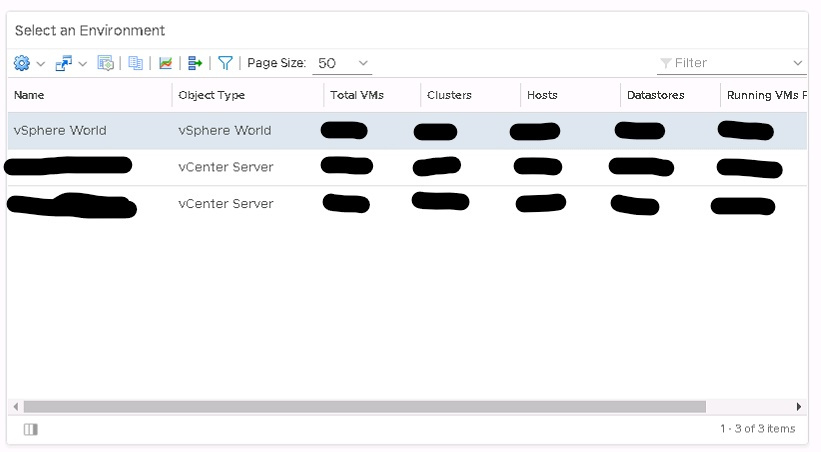
Select the widget so
in my case the select an environment
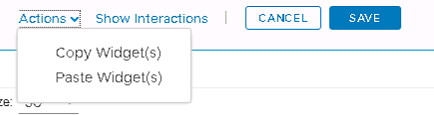
Then select Copy
Widget(s)
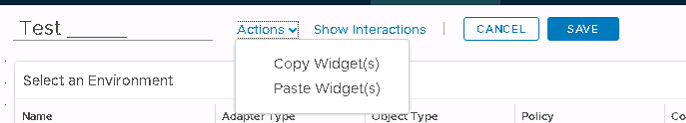
Return to the other
tab with the new dashboard
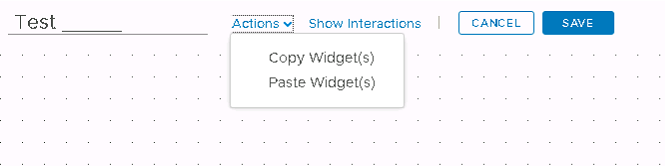
Select paste widget
Congratulations you
have successfully copied and pasted a widget from an existing dashboard into
your custom. I could stop the blog
article here but let’s go a little further and have some fun.
Rinse and repeat a
metric you want from a completely different existing dashboard.
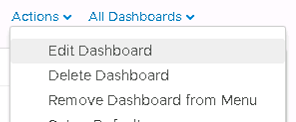
Once again go to
edit the dashboard with the widget you want
The widget I want to
copy and paste is for VM CPU Demand > 80% and it is a Self-Provider – this
is important to remember
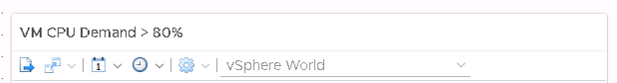
Also note that it is
collecting against the vSphere World by default
Select the widget
click Copy Widget(s)
Now return to the
new dashboard and click paste

Paste
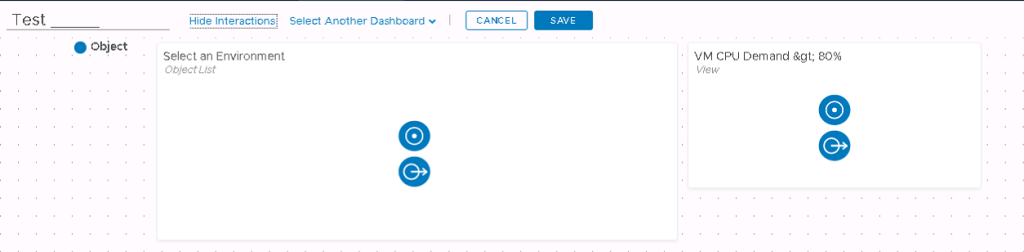
Since the VM CPU
widget was pulling from vSphere World it is already reporting data even if you
click on different vCenter(s).
This may present a
problem if you are wanting to toggle between vCenters

Click on show
interactions
Lets change this
real quick
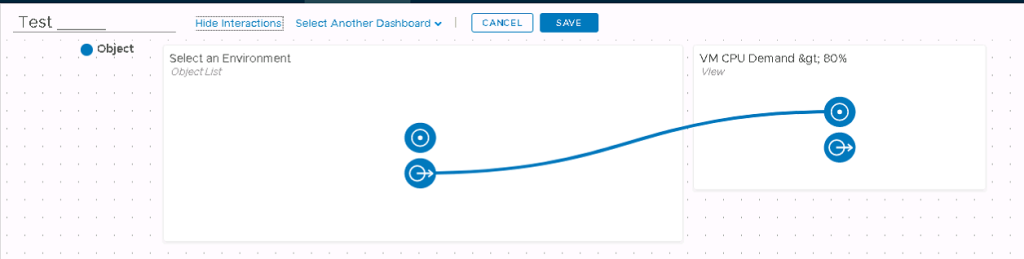
Much better but
still not done yet.
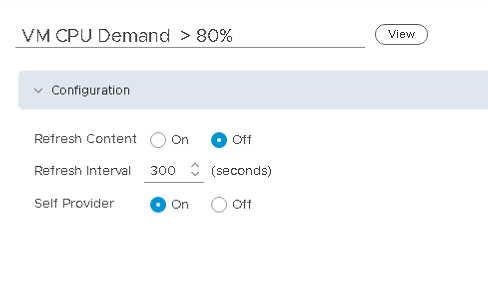
Let’s go back to the
VM CPU widget and select the pencil to edit
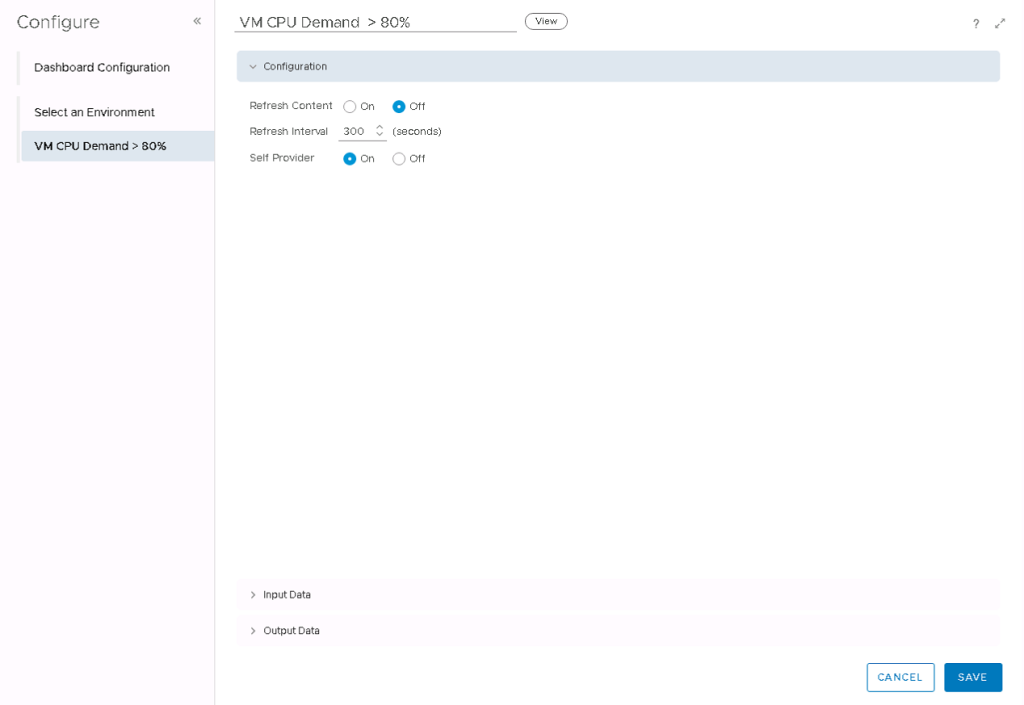
Let’s change Self
Provider from on to off

Save
Save
Now you should be
able to toggle between your vCenters and see the different list of VMs with CPU
higher than 80%. We have successfully
taken two widgets from existing dashboards and had them interact to report the desired
metric.
Summary:
I find creating custom dashboards can sometimes be a pain, especially, when the widgets you want are already in existing dashboards. The copy and paste feature with some mild tweaking of the metrics allows for much faster dashboard creations. In addition, it is not that difficult to take 2/3rds of the widgets you need and copy and paste and then create the custom widgets. This helps speed up the process I find. I hope y’all found this article useful.